Data Science
| Module Name | Topic | Target Grades | |
|---|---|---|---|
 |
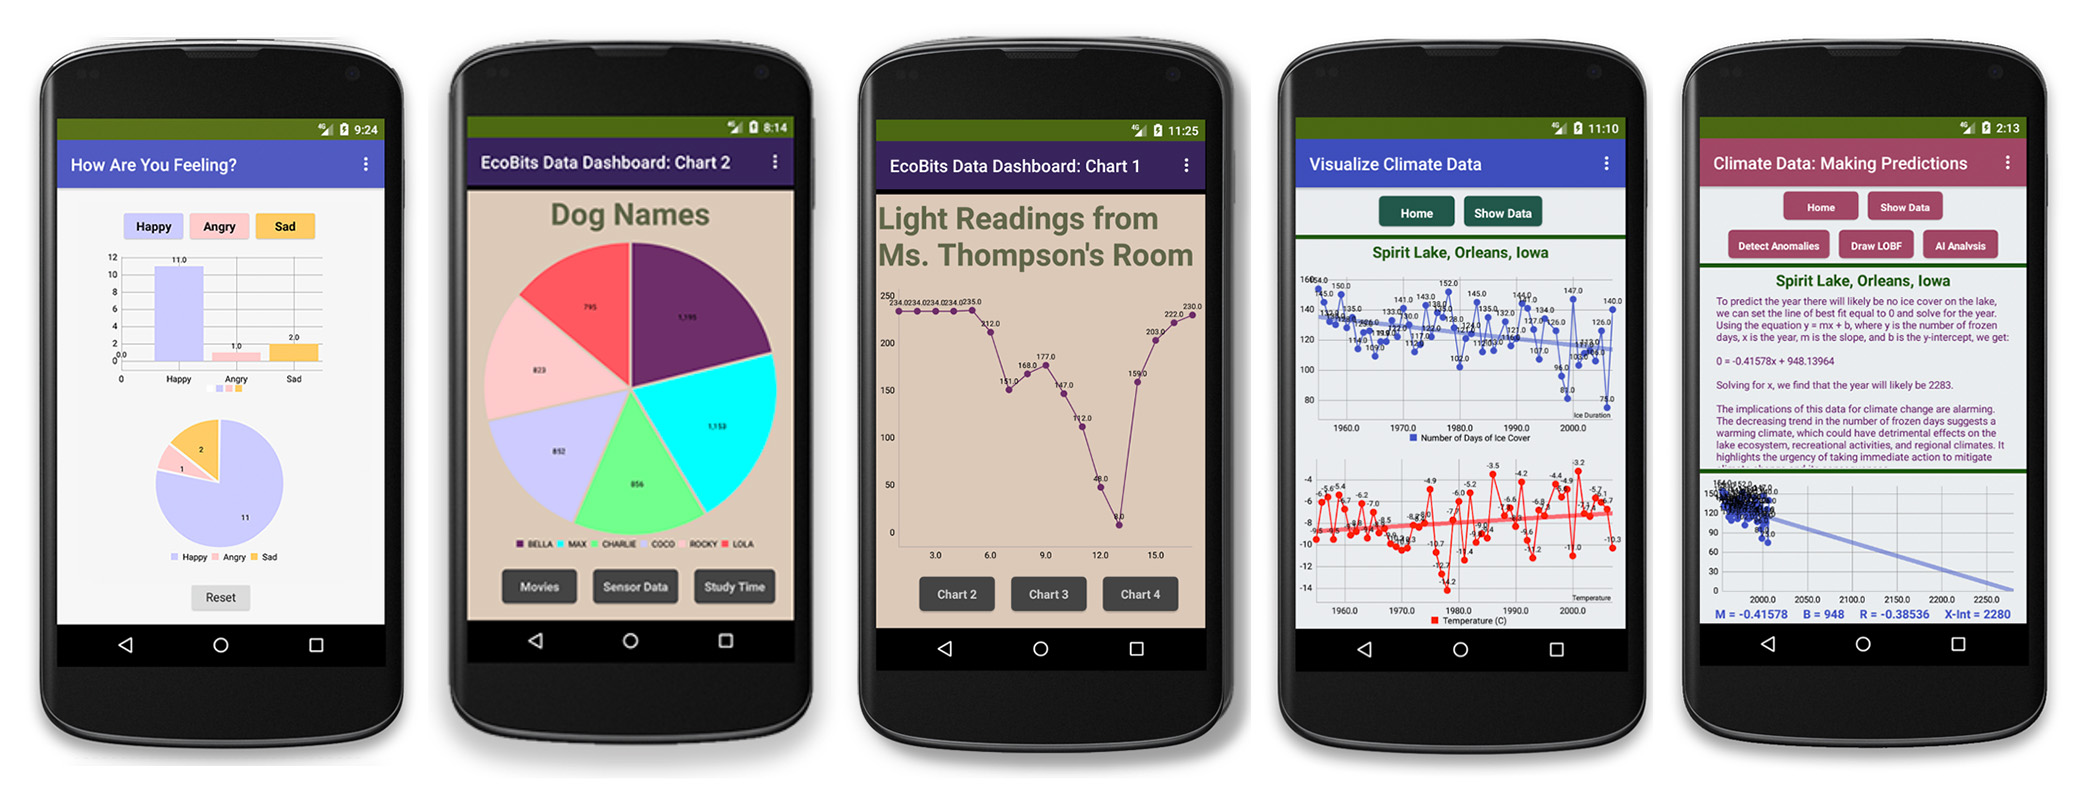
Data Using Bar Graphs and Pie Charts | Survey Data | Ages 10-18 |
 |
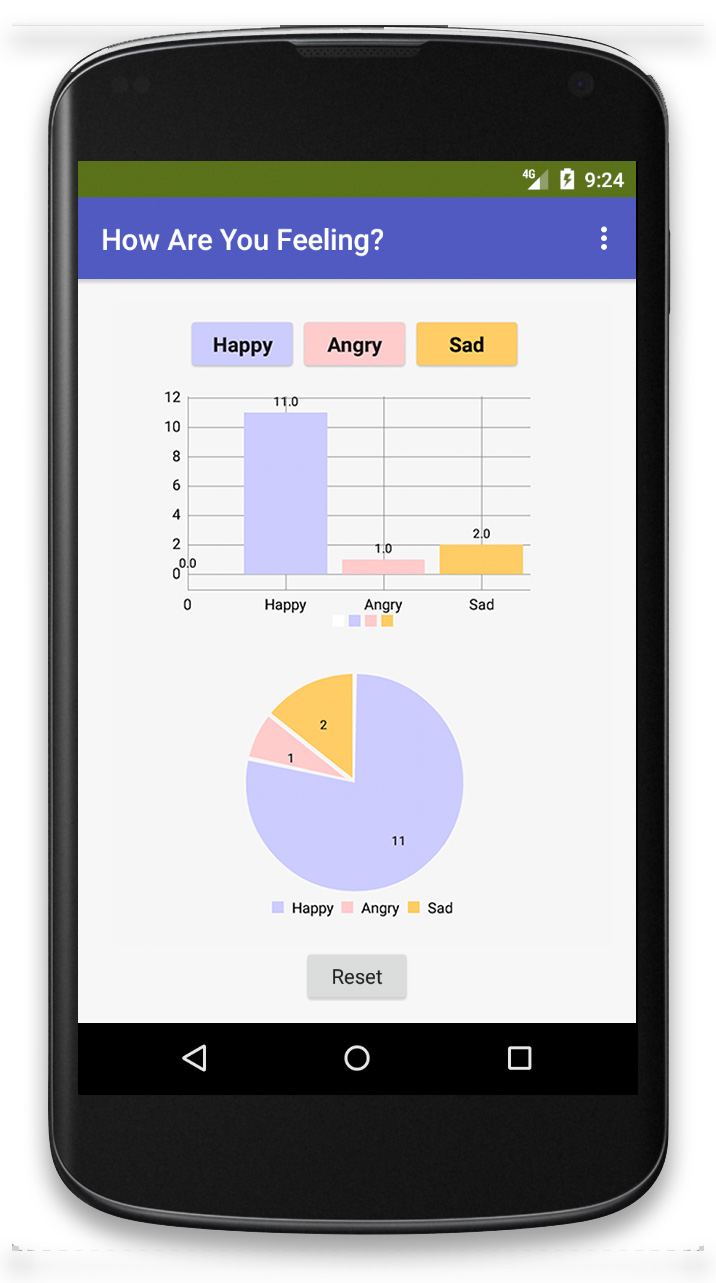
EcoBits Explorers: Environmental Data Collection using Micro:bits |
Visualizing Sensor Data | Ages 10-18+ |
 |
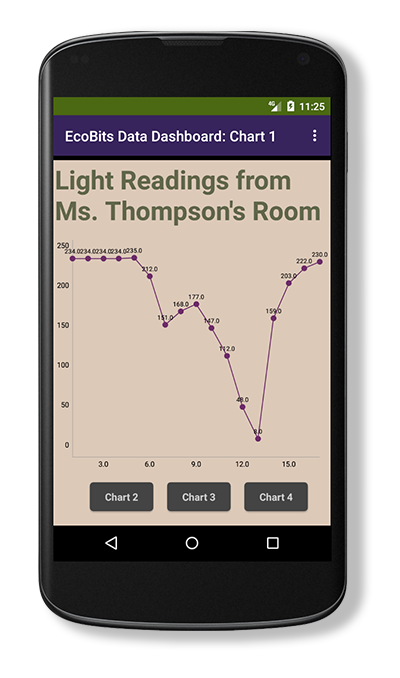
IceMelt: Modeling and Predicting Climate Change | Visualizing and Modeling Spreadsheet Data | Ages 18-18+ |
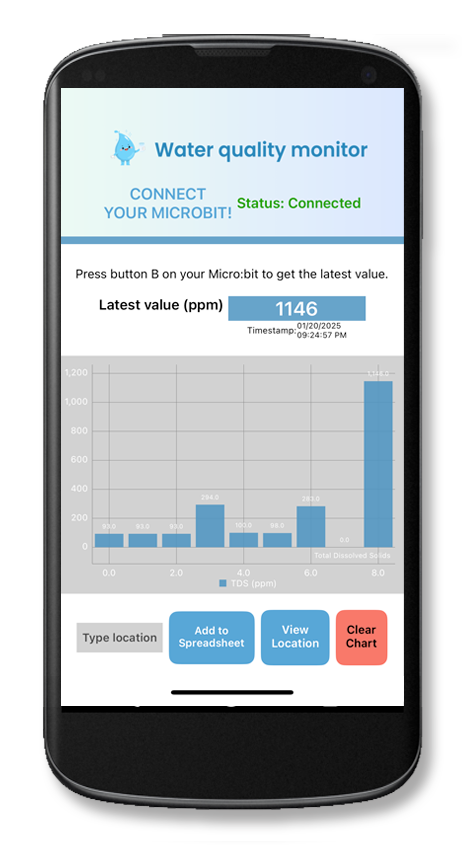 |
Day of Climate Curriculum: Climate Change Happens below Water |
Monitor water quality, using affordable sensors and analyze data related to pH and soluble materials. | Ages 10-18+ |
| Appendices | |||
| Connect Your App to Your Own Spreadsheet | |||
| Create a Credential for Google Sheets | |||
| Write New Data to a Spreadsheet from Your App | |||
| Obtain your own OpenAI API Key | |||
| Actuate a motor or lights | |||
| Sense temperature, light, and moisture | |||
MIT App Inventor


This work is licensed under a Creative Commons Attribution-ShareAlike 4.0 International License.
Terms of Service and Privacy Policy
App Inventor Support: Community
Other inquiries: Email
GitHub: mit-cml
Accessibility: accessibility.mit.edu


Other inquiries: Email
GitHub: mit-cml
Accessibility: accessibility.mit.edu