A Look at Component Usage in MIT App Inventor
Dec 19, 2020 evan's Blog
We recently analyzed App Inventor projects present in the system as of September 2019. The snapshot we used contained 42,734,420 projects (as of 2020-11-03, we now have over 54 million projects in App Inventor). This analysis focused on components to help us better understand where most effort is put into App Inventor projects. The purpose of this blog post is to share some of our findings with the App Inventor community.
Here are the top ten components by number of projects they appear in (excluding Screen):
- Button (33,176,032)
- Label (24,940,319)
- HorizontalArrangement (18,449,578)
- TextBox (12,784,661)
- Canvas (11,116,497)
- Clock (7,788,466)
- Image (7,697,079)
- Sound (6,581,615)
- VerticalArrangement (5,683,910)
- ImageSprite (5,675,341)
There aren’t really any surprises here. Most of the top components are used for visual display and layout of content. The only exceptions are Clock and Sound. In terms of component usage, there is a very long tail once extensions are considered:
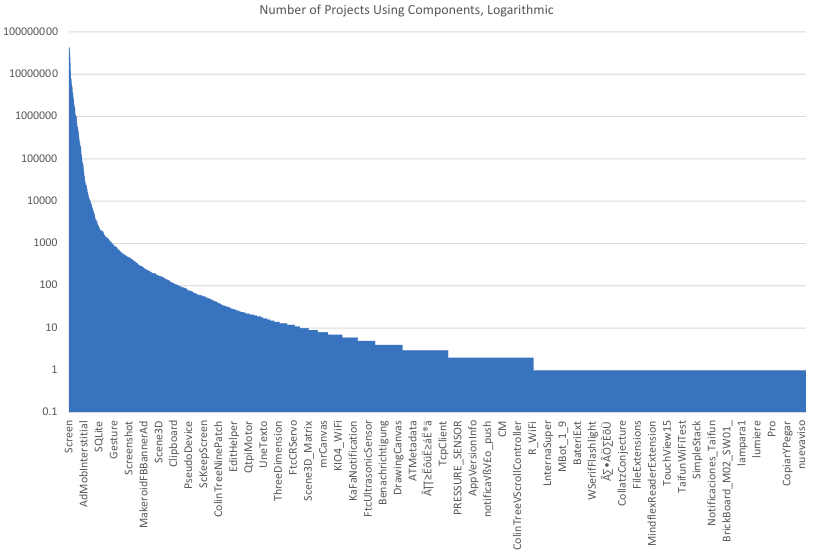
The X axis represents the components (and extensions) by name, ordered by usage. Note that the Y axis in the above figure is logarithmic due to there being 7 orders of magnitude difference between the most used and least used components.
We next counted the total number of instances of a component type across all projects. Here are the top ten components by total number of instances (excluding Screen):
- Button (150,837,320)
- Label (129,922,932)
- HorizontalArrangement (72,340,662)
- TextBox (34,141,489)
- ImageSprite (21,837,581)
- Image (20,677,887)
- VerticalArrangement (18,599,572)
- Canvas (13,984,065)
- Sound (12,753,965)
- Clock (12,054,067)
Note that while overall no components leave or enter, the order of top components change to favor more user interface elements.
Next let’s take a look at components by average number of uses in projects in which they appear:
- Polygon (20.481152)
- Label (5.209353)
- Button (4.546575)
- LineString (4.006542)
- HorizontalArrangement (3.920993)
- ImageSprite (3.847801)
- Marker (3.632575)
- Circle (3.559295)
- CheckBox (3.493395)
- VerticalArrangement (3.27232)
Map related components make a good showing here, with four out of five map features making the top 10. The average number of polygons for projects that contain polygons is particularly high compared to other components. While we haven’t looked more in depth at this, one hypothesis is that many of these projects use our example of the 50 United States map, which brings the average up.
We also aggregated components by the maximum number used within a single project. The top ten components by use in a single project were:
- Label (5,546)
- Button (5,366)
- LineString (5,280)
- HorizontalArrangement (4,270)
- TextBox (2,834)
- ImageSprite (2,195)
- CheckBox (2,160)
- Ev3UI (1,764)
- VerticalArrangement (1,748)
- Polygon (1,609)
It’s amazing that people have built these really involved applications with App Inventor. The one component in particular that stands out is the use of the Ev3UI component, which is used to display content on the LEGO® MINDSTORMS® Ev3 robot. It would be interesting to see how many robots are being controlled by that app.
In our dataset, there were over 3200 unique extensions present and extensions were used in roughly 2% of App Inventor projects. The most commonly used extensions (by project count) were:
- BluetoothLE (90,659)
- ThunkableAdMobInterstitial (62,994)
- ThunkableAdMobBanner (46,874)
- AdMobInterstitial (38,596)
- TaifunNotification (29,422)
- TaifunTools (27,314)
- MBot (24,358)
- TaifunFile (23,754)
- TaifunFlashlight (23,307)
- SpaceView (19,570)
Note that it is possible that a project uses more than one extension, so there may be some overlap in the project counts above.
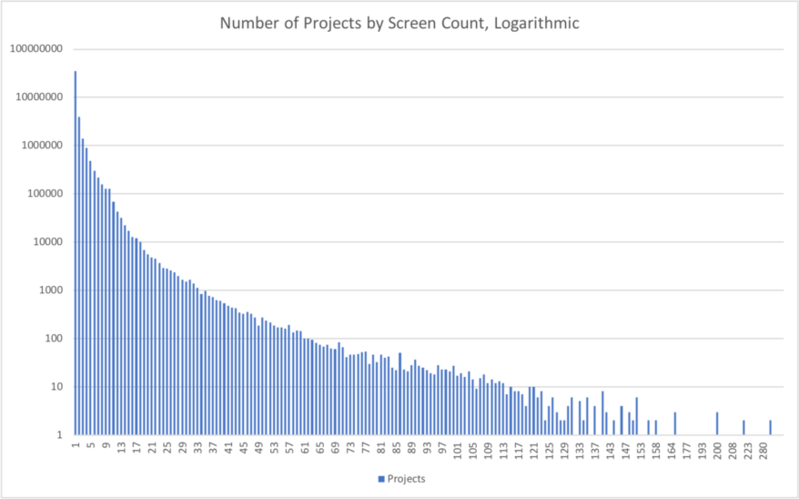
Screen use is also an interesting item to look at. Our general recommendation is that one shouldn’t include more than 10 screens in a project. Projects contained an average of 1.5 screens, but the largest project had an astonishing 396 screens. This shows that most projects stick to only a single screen but that there is a very long tail in terms of the extent to which people create screens. Over 270,000 projects violate the 10 screen suggestion. Below is a distribution of the number of projects (presented logarithmically) using a given number of screens.
Overall, these data provide interesting insights into the use of components in App Inventor projects. Further blog posts will explore other areas of App Inventor projects.
MIT App Inventor


This work is licensed under a Creative Commons Attribution-ShareAlike 4.0 International License.
Terms of Service and Privacy Policy
Other inquiries: Email
GitHub: mit-cml
Accessibility: accessibility.mit.edu