Live Development
App Inventor Classic • App Inventor Classic • FOR APP INVENTOR 2 CLICK HERE • App Inventor Classic • App Inventor Classic
Live Development, Testing and Debugging
The Blocks editor includes several valuable features to support incremental development and testing as you create your applications. You can also make use of the Java console and the Android log to explore problems, but these will be mostly of use in reporting bugs in App Inventor rather than in debugging your own apps.
Incremental development with the Blocks editor
When you create apps with App Inventor, you are working on the phone live: Drag a button icon to the Viewer and the button appears on the phone right then; change the button's color in the Designer and the color changes; drag out a block that makes something happen when the button is pressed, and you can press the button right then on the phone to see it happen.
This kind of feedback is enormously useful, because it lets you develop and test your apps incrementally, defining each bit of new behavior and testing as you go along. Inexperienced programmers often make the mistake of building a large amount of stuff before they test any of it. Then, when they run into bugs, they're faced with a huge tangle to sort out, where they don't know which pieces are working and which are not. So try to work incrementally. You'll still surely encounter bugs, but incremental development will let you isolate bugs more quickly and fix them more easily.
In addition to letting you try things by interacting with the phone itself, App Inventor includes features to aid in testing and debugging while you are using the Blocks editor. You can see these if you right-click on a block. This will bring up a menu, as shown here for a block that calls the procedure MoveMole:
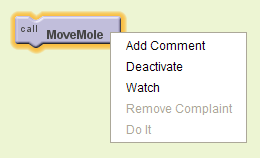
Not all blocks will offer the same choice in the menu.
Do It
You can perform the action for a block with Do It. In debugging a program like MoleMash, you could select Do It for MoveMole and see if the mole moves on the phone.
Do It not only does the block's action, but also puts up a balloon that shows the value returned. The figure below shows the use of Do It on an addition block to show the result of addding two numbers called this and that.
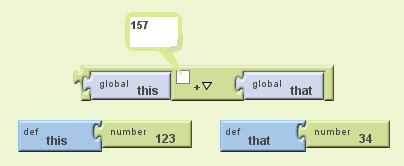
Result balloons are attached to blocks at a point indicated by a small equals sign. You can click on the equals sign to hide and show the result. Moving the mouse away from the block makes the result balloon go away.
Deactivate
Sometimes you want to keep a block around that's not really part of your app. Maybe it's a part of the program that's not yet finished, or a block that's only partially implemented. Choosing Deactivate from the block menu will keep the block from becoming part of the app when you package it. Selecting Activate restores the deactivated block.
Collapsing blocks
If your app has many blocks, they won't all fit on the screen at once. You'll need to scroll the Blocks Editor window, and that can be awkward. One way to help keep screen real-estate small is to use block collapsing. If you click on the minus sign at the lower left of a procedure block or an event-handler block, the block will collapse so that only the title will be visible. Clicking on the plus sign will restore the block to full visibility.
Comments
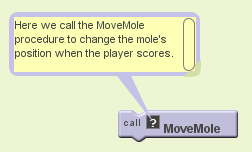
Adding comments to blocks is a good way to help others understand your programs. It's also useful for keeping track of your own programs. Selecting Add Comment from the block menu brings up a balloon attached to the block, where you can type a comment as shown:
You can drag the balloon around, or resize it. The comment balloon is attached to the block at a spot with a small question mark, that you can click to hide and show the comment. Or you can remove the comment permanently by right clicking on the block and choosing Remove Comment.
Watching variables
If you click Do It on a block that shows the value of a variable, you'll get a result balloon showing that value of the variable at the time you clicked. But sometimes, especially in debugging, what you really want to see is how the value changes as your program runs. Clicking "Watch" opens a baloon whose result constantly monitors the value of the variable, so you can see if your program is changing it as anticipated.
Complaints
Sometimes the result of doing a block will be an error. In the picture below, we changed the value of that to be the text "apple", and clicked Do It to add this and that. The result is an error, and a complaint:
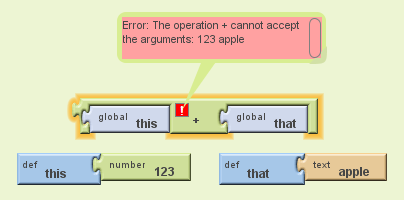
The complaint balloon is attached to the block at a small exclamation point, which you can use to hide and show the complaint. You can also remove the complaint by choosing Remove Complaint from the block menu.
System Logs
Besides the debugging tools in the Blocks editor, you can sometimes get information from various logs. This is generally for advanced users only.
The Android Log and adb(Advanced)
If you have problems on the Android device, you can sometimes get information by inspecting the Android Log. For example, if your application runs out of space, that will be recorded in the log. The messages in the are not generally intelligible, but you can use the Notifier component to make your app write messages into the log, and this can be of some use in debugging.
You can read the log using the Android Debug Bridge (adb). The adb program is installed on your computer as part of the App Inventor installation process, and you can use the logcat option to view the log. You can launch adb from the terminal on your machine. Go to the directory containing the AppInventor Extras software and run the command adb logcat This will display the entire (large) system log. If you are debugging, you should open the log, stimulate the bug again, and see what appears at the end of the log.
The actual directory for adb depends on your operating system:
- For MacOs it's /Applications/AppInventor/commands-for-Appinventor.
- For GNU/Linux it's /usr/google/appinventor-extras/commands-for-Appinventor
- For Windows, it can be in one of several places, depending on how it was installed. Search on your machine for the \Android\appinventor-extras folder, containing the file adb.exe.
For more information on adb, see see the Android Debug Bridge web page.
The Java system log (Advanced)
Not all bugs will be your bugs. App Inventor has bugs, too, and you might encounter them. There's not much you can do here, other than report the bug, but you might get some idea of what's going on or at least get information for reporting error messages by using the Java console to display the system log.
The Blocks editor is a Java program, and many of its operations write messages to the Java system log. You can see these messages if you run the Blocks editor with the Java console open.
Running with the Java console open is a preference you specify for Java before you start up App Inventor. The details depend on which operating system you're using:
- For MacOS, go under Applications ? Utilities ? Java Preferences, and choose the Advanced tab. You'll see an option under Java Console to show the console.
- For Windows, go under Java in the control panel and choose the Advanced tab. You'll see an option under Java Console to show the console.
- For GNU/Linux you'll need to find the program
javaws, which should be in the directory where Java was installed. The commandjavaws -viewerwill open a control panel. Choose the Advanced tab. You'll see an option under Java Console to show the console.
MIT App Inventor


This work is licensed under a Creative Commons Attribution-ShareAlike 4.0 International License.
Terms of Service and Privacy Policy
Other inquiries: Email
GitHub: mit-cml
Accessibility: accessibility.mit.edu